Nursing A.A.S. (ADN)
What is an Associate Degree in Nursing?
The Associate Degree Nursing program prepares graduates to deliver quality care to promote and/or maintain and restore health and well-being. Emphasis of this program will be educating the student to perform holistic nursing care in a variety of healthcare settings.
Licensed LPNs can complete the: LPN to RN Transition Program
This program includes coordinated classroom and clinical instruction. Students who earn an Associate in Applied Science Degree in Nursing must successfully complete the Virtual ATI NCLEX-RN review course to be eligible to sit for the National Council Licensing Examination (NCLEX-RN). Success on the NCLEX-RN examination and state licensing qualifies a trained nurse as a registered/licensed nurse.
The Associate Degree Nursing program at Lehigh Carbon Community College at the Main Campus located in Schnecksville, Pennsylvania; at the Donley Center located in Allentown, Pennsylvania; and at the Morgan Center located in Tamaqua, Pennsylvania is accredited by the Accrediting Commission for Education in Nursing (ACEN), 3390 Peachtree Road NE, Suite 1400, Atlanta, GA 30326; 404-975-5000; www.acennursing.org.
The Practical Nursing Certificate program at Lehigh Carbon Community College maintains full approval status with the Pennsylvania State Board of Nursing.
Nursing Courses
Your nursing courses will prepare you for success in either a future career or when pursuing a four-year degree. In this program, you’ll take classes like:
- Anatomy and Physiology I and II
- Human Growth and Development
- Nursing I, II, III
Course Fees
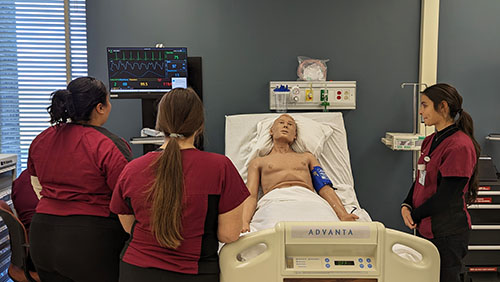
Health Care Patient Simulation Center
The Patient Simulation Center encompasses both high- and low-fidelity patient manikins. The labs connect classroom learning with real-life clinical experience and help students build confidence as they learn to interview and care for patients. The students apply the knowledge they learn in the classroom to ongoing patient scenarios. Learning in a controlled environment allows the student to learn without compromising the safety of an actual patient, as they receive feedback from the Nursing faculty. The sim lab allows the students to develop critical thinking skills and problem-solving skills.
Pathway to a Career in Nursing
Advance your career at your own pace. Each step below transfers credits to the next. Appropriate job titles and average pay ranges are meant to help guide an individual interested in this field; they vary based on individual experience and employer.
Certificate
Practical Nursing Certificate
Lehigh Carbon Community College
- Licensed Practical Nurse (LPN)
Wage information taken from Lightcast Q1 2024 BETA Data Set – QCEW Employees. Wage range is 25%-75% hourly average in surrounding 10-county region.
Health Science Career Pathways
Bachelor’s Transfer Schools
Students who graduate with the nursing program and obtain state licensing as a Registered Nurse can continue their nursing education for a Bachelor of Science in Nursing Degree (BSN). LCCC has partnership agreement with a number of RN-BSN programs. Learn more about transferring to a four-year school.
Your A.A.S. in Nursing prepares you to transfer to the following four-year colleges or universities:
State Licensing and Credential Requirements
The Nursing A.A.S. program at Lehigh Carbon Community College is approved by the PA State Board of Nursing and accredited by the Accreditation Commission for Education in Nursing (ACEN). Upon completion of the program, students will apply for licensure by examination by completing the National Council Licensing Examination (NCLEX). The application and requirements for nursing licensure are unique to each state. The below information is meant to provide a resource. This is not a definitive list of the requirements for nursing licensure. Please refer to the State Board of Nursing for full requirements for application.